
| Return to Update Page | Return to Site Map |
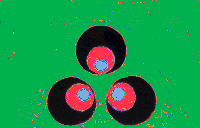
This map shows the green with its current diagnosisScale: each black bar is 10 feet. | |||
Blue shows places that are good now, and need to be protected
Green shows places that have potential to become something goodRed shows places that are really bad now, and need to be fixedYellow shows centers that urgently need to be established as centers, and boundaries that need to be established as boundaries |